How to tell irrigated landscaping from natural fuel load in satellite imagery
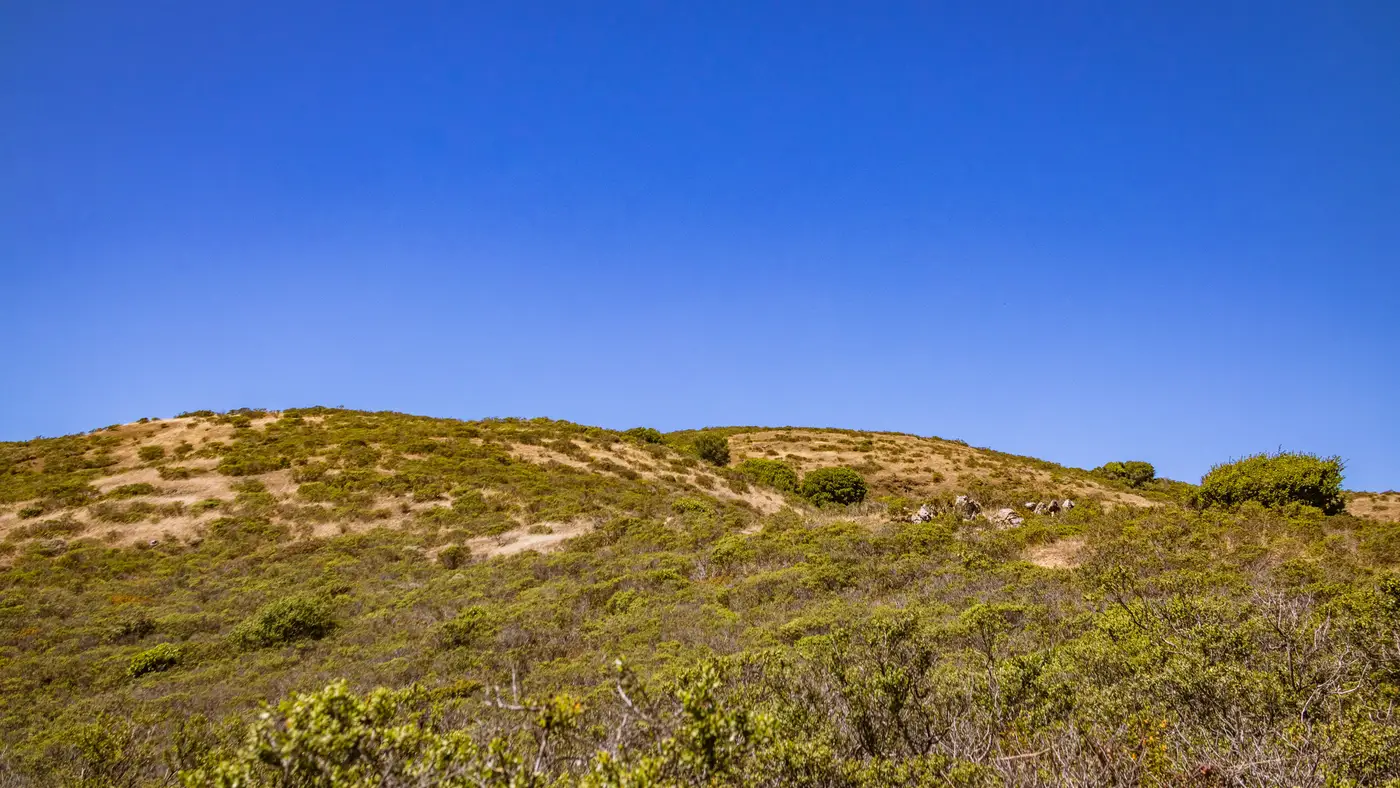
A homeowner clears zone 1 and plants a ring of drought-tolerant shrubs around the structure, on an irrigation line. Fine. But six months later, in a dry RGB satellite pass, that irrigated bed and the unmanaged manzanita forty feet downslope can read almost identically: green, dense, same canopy texture at a 0.5 m ground sample. An adjuster eyeballing the pull has no way to tell a maintained landscape from fuel that just hasn't cured yet. That's the gap that gets missed on a desk review, and it's the one a field inspector catches by walking the parcel and putting a hand on the leaves.
The near-infrared band catches what the visible bands miss, without a boot ever touching the parcel.
Why RGB alone can't make the call
Visible-light imagery tells you color and shape. It does not tell you water content. A healthy irrigated hedge and a stand of chaparral that's had a wet spring both show up green in true color, both cast similar shadows, both can have comparable crown density in the pixel count. If your workflow stops at RGB, you're scoring vegetation density and calling it compliance, but density alone doesn't tell you whether that vegetation is a managed, irrigated buffer or standing natural fuel that's going to cure out by August and sit inside the required clearance all through fire season.
This matters most in zone 1, the area closest to the structure where the rules are strictest and the margin for misjudging a species or a moisture state is smallest. A parcel that looks clean in a spring RGB pass can still have a fuel problem the underwriter never sees, because the pass was timed to the one month a year everything looks the same shade of green.
What the NIR band actually shows
Live, well-watered vegetation reflects strongly in near-infrared, a byproduct of healthy leaf cell structure holding water. Cured grass, stressed brush, and drying natural fuel reflect far less in that band even while they can still look green, or green-brown, in the visible spectrum. Stack the NIR band against RGB for the same parcel and the irrigated landscaping and the native fuel separate out, because one is holding moisture that the sprinkler keeps replenishing and the other is on its way to becoming the cured fuel load that carries fire to the structure.
That NIR moisture signature is also why a single RGB flyover a year isn't enough to score defensible space with any confidence. Vegetation on a fixed irrigation schedule holds its NIR reflectance through the dry months. Native fuel doesn't. The two can start a season looking the same and finish it looking nothing alike, and the imagery needs a cadence that can register that drift rather than one snapshot that happens to land when both are green.
Reading zone 1 against the requirement
With RGB and NIR together, the read works like this: flag anything inside the zone 1 radius with vegetation density above the clearance threshold, then check the NIR signature on that flagged vegetation to see whether it's irrigated and holding, or curing natural fuel that's still drying out before the next renewal. Doing that by hand, parcel by parcel, across a full book of risks is a different problem entirely. A homeowner's attestation that they maintain a defensible perimeter is worth something, but it isn't the same as a per-address measurement you can check against the zone requirement before you bind or renew, or hand to a regulator asking how the score was built.
Defensible Space runs that RGB-plus-NIR read on every address, scored zone by zone against clearance requirements, from VHR imagery at a 0.5 m ground sample captured on an annual cadence. If you're still deciding compliance off a visible-light pass and a homeowner questionnaire, it's worth seeing what the moisture signature adds to the call.